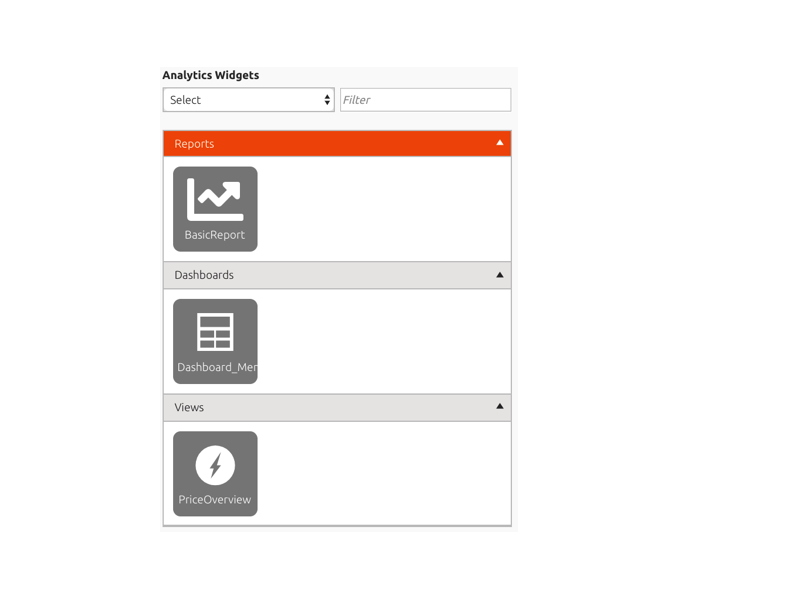
Analytics widget

An analytics widget represents a report created by making use of the report designer (see Introduction Analytics module ) that can be embodied as an widget.
An analytics widget can be added to a board by dragging it to the content of the board and dropping it on any desired location. An analytics widget can be embodied in one off the following types:
- Report
- View
- Dashboard
Report
This report type makes it possible to create highly detailed advanced reports based upon BizzStream documents including geographic maps, crosstabs, repeating groups, complex join, filter, and sort logic.
View
The view type can be considered as a basic report which comprises vertically expanding data records and groups, and an optional visualization.
Dashboard
Dashboards combine one or more, Report and/or View types, onto a design canvas, providing a way to create a personalized arrangement and display of related reports. All the aforementioned analytics widget types can be added to a dashboard, and visualizations can be created directly on the canvas without needing to make a separate report. Dashboards can also have text, borders, images, visual filters, and embedded web pages.
Configuring a Text/HTML widget
- To resize the widget, drag the bottom right corner.
- To move the widget to a different location, drag and drop the widget.
- To remove the widget, click the trashcan icon.
Filtering
Analytics widgets can be filtered by making use of the filter section which provided in the following operators:
- Equals
- Not equals
- Contains
Filtering is based upon the name (case insensitive) of an analytics widget. If an analytics widget does not match the filter criteria it (obviously) will be filtered out. If there is not one report that matches the filter criteria for a specific analytics type the whole collapsible section will be hidden.